top of page


The Art Festival
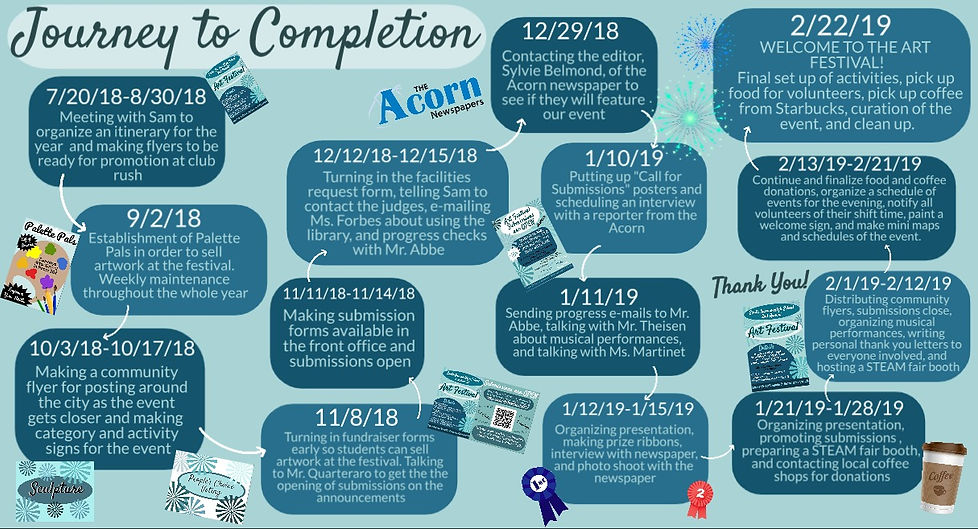
The image above is a visual map of all of the work that I have done since I started working on this project in mid-July. The small images represent things that I made during a various work session. The purpose of the graphic is to show how efficiently the work was spread out during the time I had to work on this project. Having a graphic laid out in such a way better exhibits how extensive the process for developing the Art Festival was. Click here to view my report on the entire process of making the Art Festival and an hours log that describes what exactly was done during each day in which I worked on the project.
bottom of page